AIMET visualization
Overview
AIMET visualization augments the analytical capabilities of the AIMET toolkit by providing more detailed insights into AIMET features. AIMET visualization enables you to analyze model layer compressibility, to highlight potential issues when applying quantization, and to display progress during computationally heavy tasks.
Design
AIMET visualization starts a Bokeh server session on which you invoke functions based on your model.
The figure below illustrates the server arrangement:

Compression
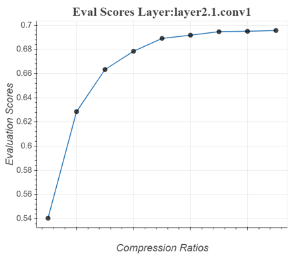
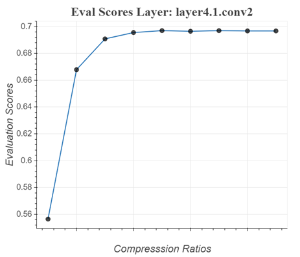
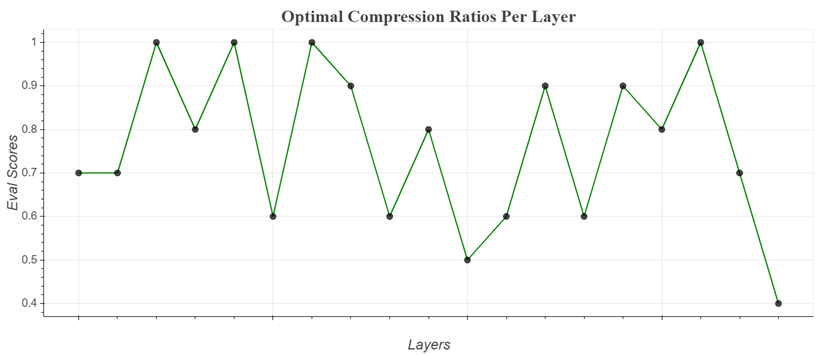
You can view evaluation scores during compression in a table as they are computed. Progress is updated in real time. After greedy selection has run, per-layer optimal compression ratios are displayed in a graph.


Starting a Bokeh server session
Start a Bokeh server by typing this command:
bokeh serve --allow-websocket-origin=<host name>:<port number> --port=<port number>
where:
--allow-websocket-originspecifies which network addresses to listen on. Required only for non-local viewing.
--portspecifies what network port to listen on. If not specified, 5006, the default, is used.
Visualizing compression ratios
Prerequisites
Install the Bokeh server if necessary:
pip install bokeh
Start the Bokeh server as described above.
Procedure
- At execution time:
To visualize eval scores and compression ratios at execution time:
Include a visualization URL,
http://<host name>:<port number>/, in the top level functioncompress_model.If no visualizations are necessary, the URL defaults to
None.View the URL to see the visualizations:
http://<host name>:<port number>/?&bokeh-session-id=compressionNote that the Bokeh session ID is “compression”.
- After execution:
To visualize eval scores and compression ratios after execution:
Decide which functions to use, one or both of:
display_eval_scoresanddisplay_comp_ratio_plot.See the “Model Compression” In the API documentation.
Instantiate a
VisualizeCompressioninstance by passing in a visualization URL,http://<host name>:<port number>/.View the URL to see the visualizations:
http://<host name>:<port number>/?&bokeh-session-id=compressionNote that the Bokeh session ID is “compression”.