AIMET visualization for quantization
Overview
AIMET Visualization provides detailed insights into AIMET features. You can analyze model layers’ compressibility and highlight potential issues when applying quantization. The tool also displays progress for computationally heavy tasks. The visualizations get saved as an HTML file.
Quantization
During quantization, common parameters are used throughout a layer for converting the floating point weight values to INT8. If the dynamic range in weights is very high, the quantization is not very granular. The weight range can be equalized by applying cross layer equalization.
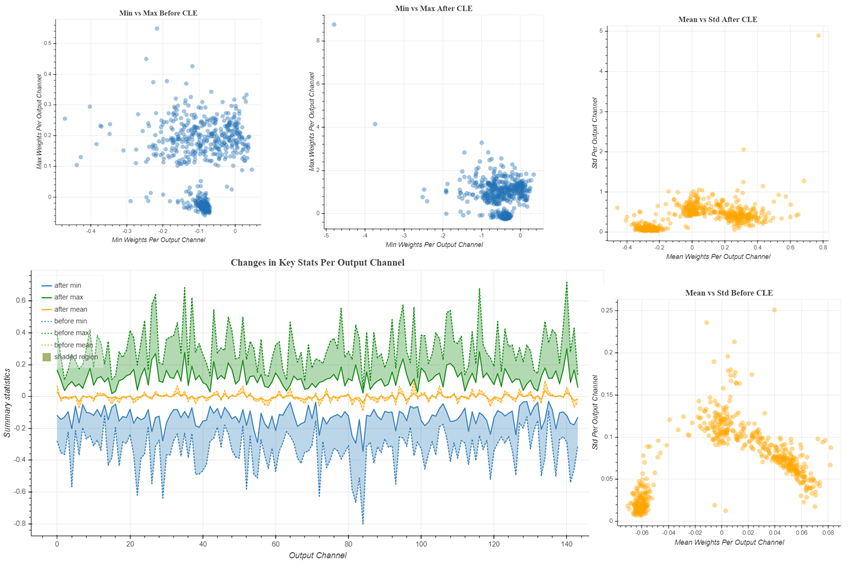
To determine if you need to apply cross layer equalization, visualize the weight range for every channel in a layer. If the weight range varies a lot across channels, applying cross layer equalization helps in improving the Quantization accuracy.
PyTorch
In PyTorch, you can visualize the weights for a model. You can also visualize the weight ranges for a model before and after cross layer equalization. There are three main functions you can invoke:
Analyze relative weight ranges of the model to see potentially problematic layers for quantization
Understand each layer in the model
Visualize the model, comparing weights before and after quantization
TensorFlow
In TensorFlow, you can visualize the weight ranges and relative weight ranges over various channels in a layer. You can also use the same functions to see the changes in a layer’s weight ranges before and after cross layer equalization.
There are two main functions you can invoke:
Analyze relative weight ranges of a layer to see potentially problematic layers for quantization
Visualize weight ranges of a layer and see the various statistics for weights